How can a spectrum tell us more than our eyes can perceive?
This Spectrum Tool will help you connect the visual color display of a light source's spectrum—like the color image you see in a spectroscope—with a graph of the light’s spectrum.Observe White Light Source
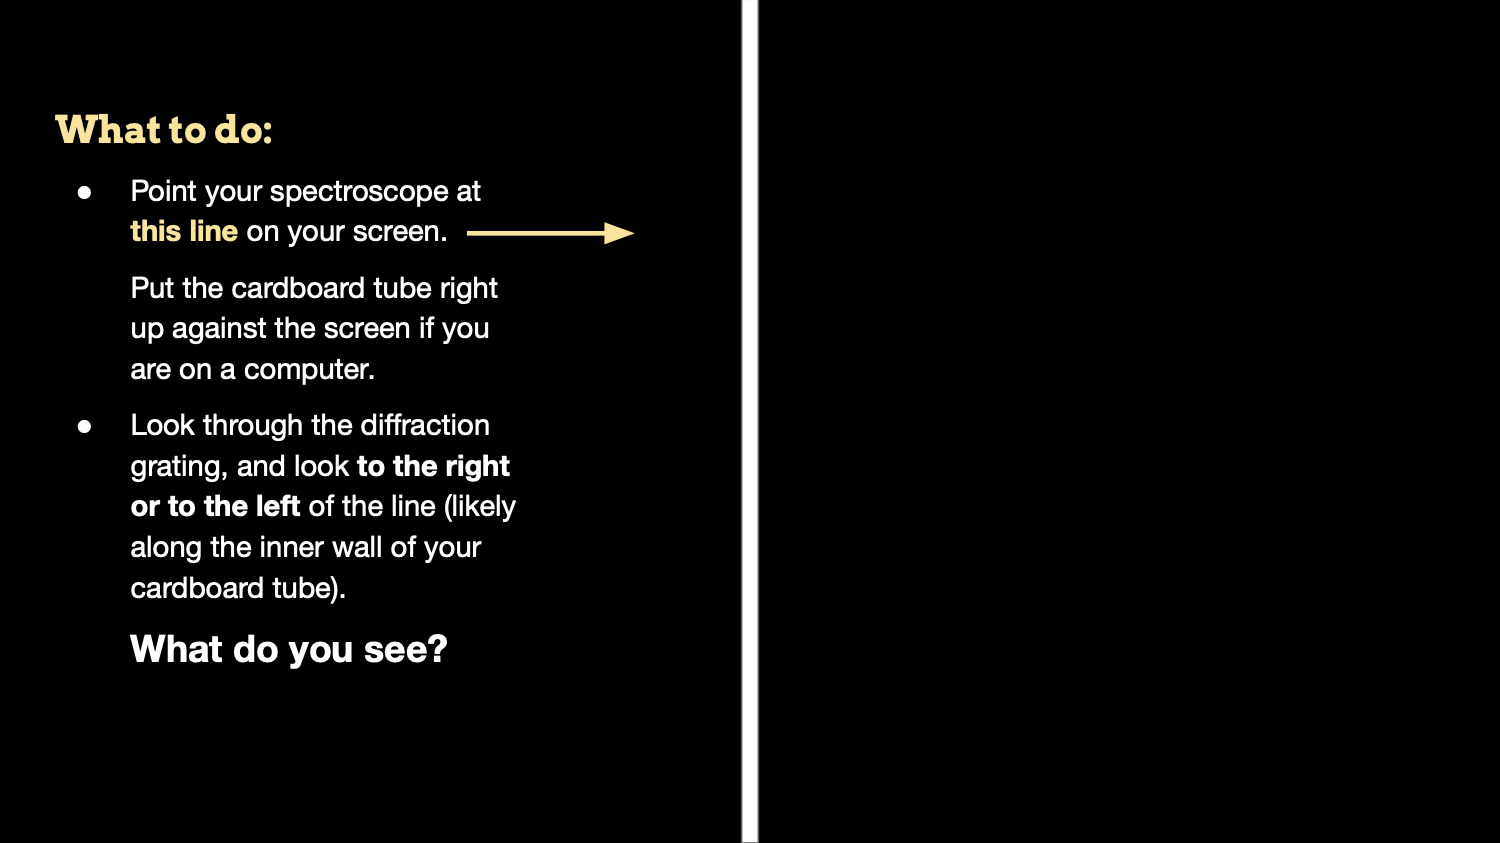
Investigate. Look at the white line on your screen through your spectroscope.
Spectrum Tool.
- Draw a graph that represents what you see in your spectroscope. (If you don’t remember what x-values are associated with each color, you can draw a straight line across the graph and use the lit up spectrum image as a reference to aid in drawing your actual spectrum graph.)
Spectrum Notebook. Answer the questions in your Notebook about the spectrum you drew.
- What colors (of ROYGBIV) do you see in your spectrum?
- Describe how the brightness of the light varies across the different colors that you see. For example, are all colors the same brightness, or are some colors bright and some dark?)

Source:
Click here to draw