How can a spectrum tell us more than our eyes can perceive?
This Spectrum Tool will help you connect the visual color display of a light source's spectrum—like the color image you see in a spectroscope—with a graph of the light’s spectrum.Build and Use a Spectroscope
Slideshow.
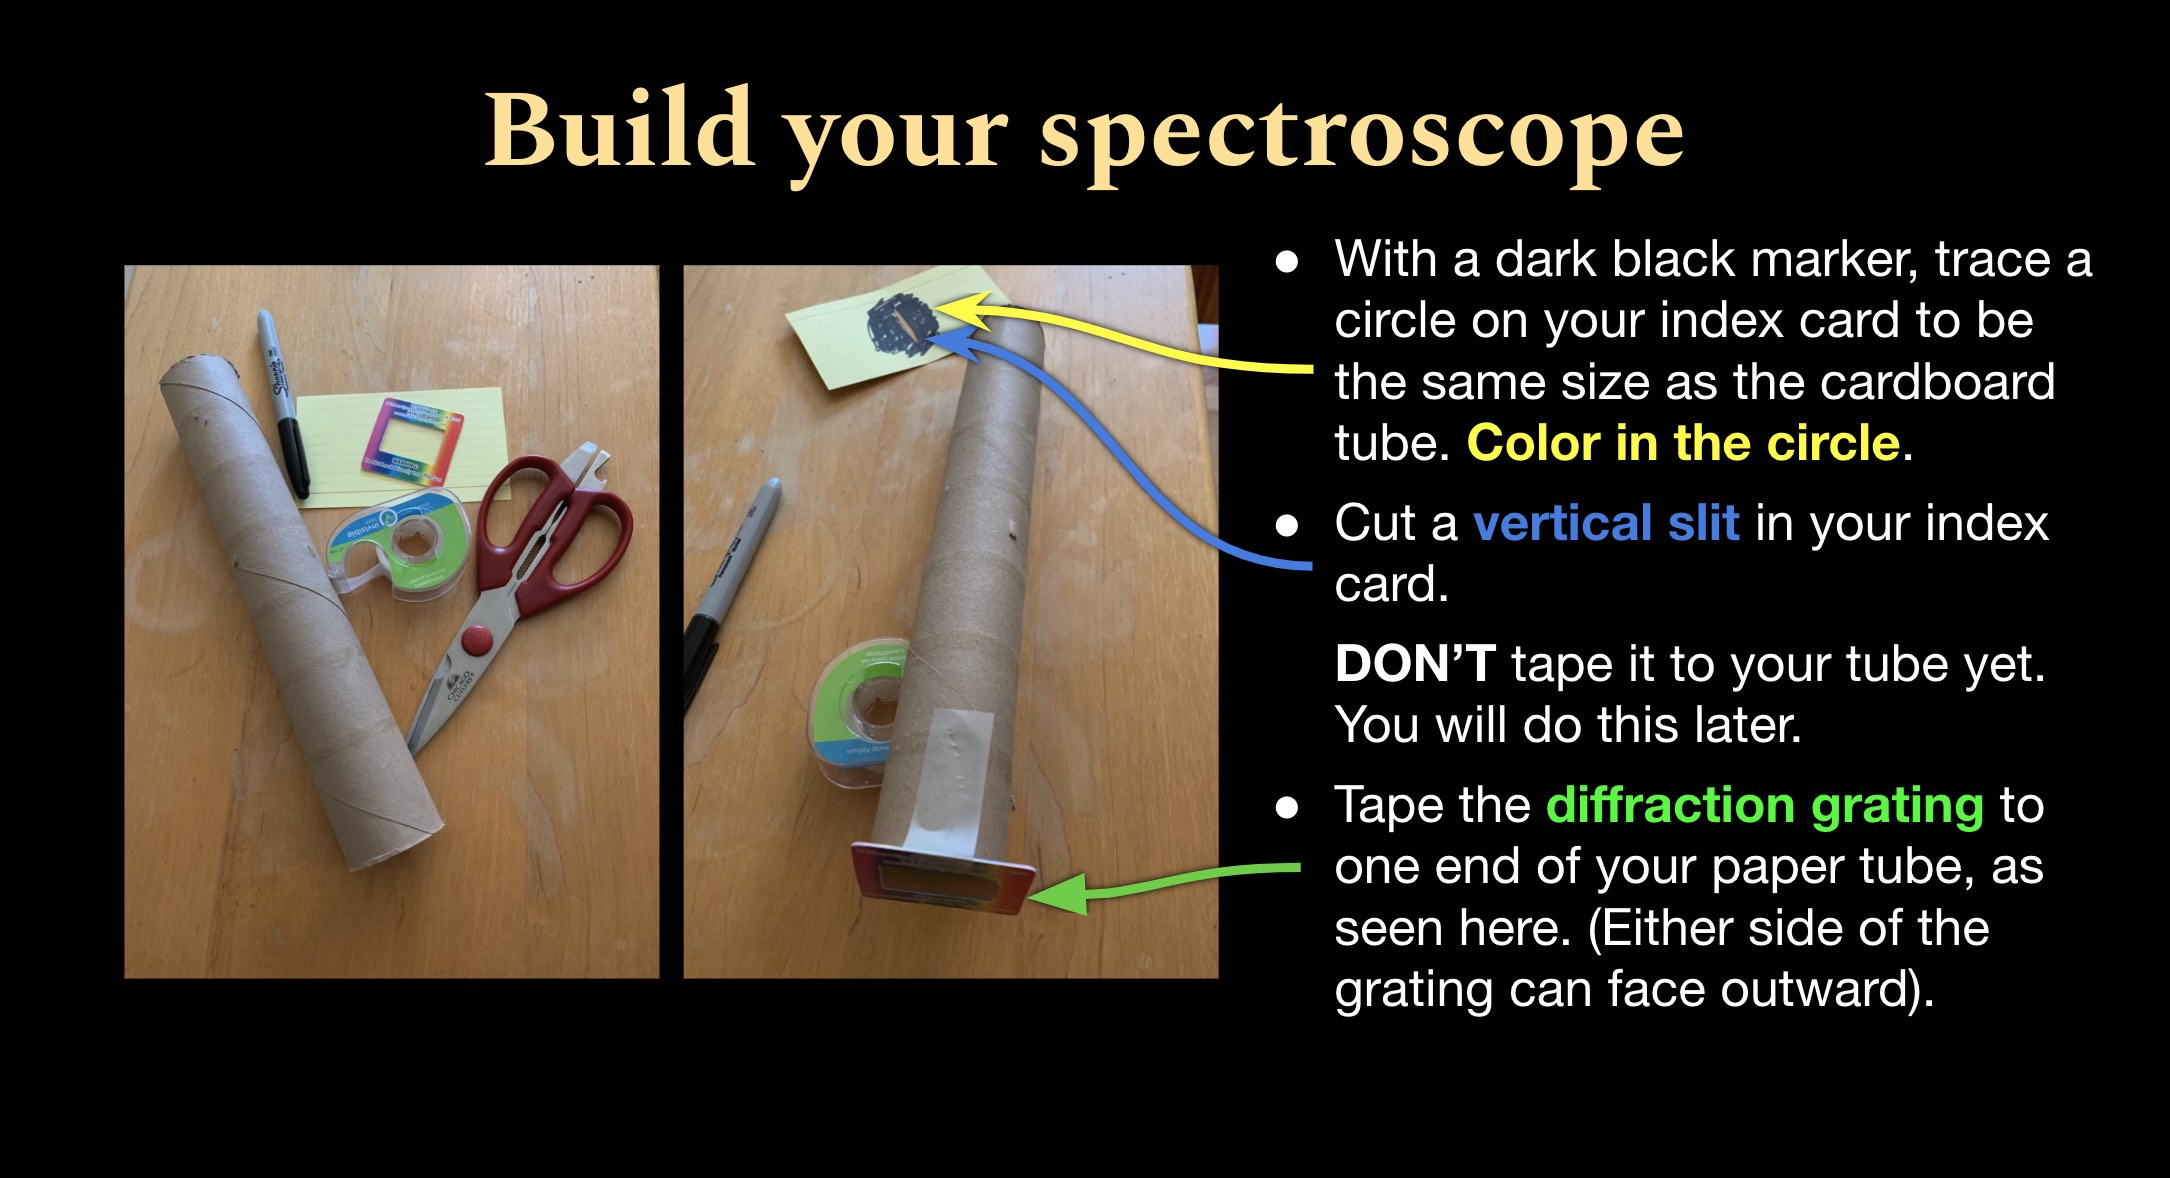
- Follow the instructions in this Slideshow to build your own spectroscope.
- Use the spectroscope to view spectra for lines of different colors within the Slideshow.
Spectrum Notebook. Answer these questions in your notebook:
- Describe what you observed when you looked through the spectroscope. How did your observed spectra change as the color of the line changed?