Other final projects
Design a Museum Display
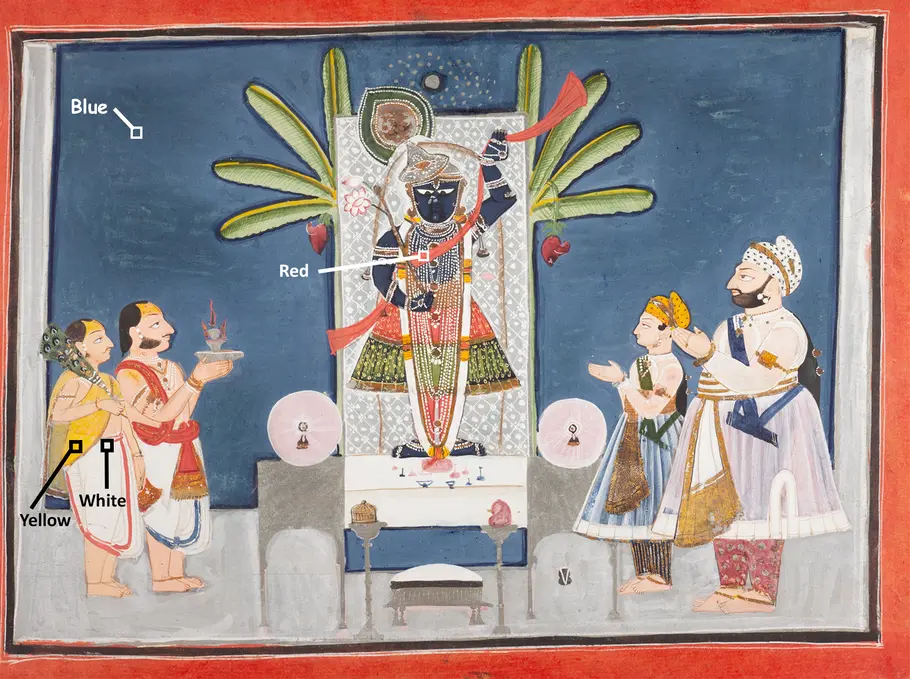
For this project, you'll design a museum display that conveys how light, color, and spectra are used in art conservation.Chokha Painting Part 2: Paint Colors and Spectra
Artwork. Scientists have taken reflection spectra of different regions of interest (ROI), marked by labeled squares on the painting below. The wavelengths of light that are reflected by the paint in the visible part of the spectrum determines what color our eyes see.
- Hover your mouse over the painting to see an enlarged view of that region.
Spectrum Tool. View each "mystery pigment" spectrum and see if you can identify what color and region of interest it corresponds to in the painting.
(Find the Spectrum Tool by scrolling down below the painting.)
- Use the Select pigment dropdown menu to view each spectrum.
- Under NORMALIZE DATA, click visible.
- Use what you learned about how light colors mix (Modules 1 & 3) to identify what color corresponds to each spectrum.
Spectrum Notebook. Complete the table in your notebook, identifying the color of the region of interest you think corresponds to each Mystery Pigment spectrum.
Simulation. If you'd like a refresher on how light colors mix, double-click the "RGB Bulbs" to launch the PhET Color Mixing simulation.

 Brightness